  By SuperWest Sports Staff
   February 2, 2025
The Associated Press (AP) Football Poll has run continuously since 1936. Up to 1960, the poll ranked only 20 teams. From 1961 to 1967, it was reduced to just the Top 10.
The Poll returned to ranking the Top 20 teams in 1968, retaining that format through 1988. In 1989, it was expanded to the Top 25, and has not altered its count since.
Initially, AP did not conduct a preseason poll, adding it in 1950.
Through 1968, except the 1965 poll, AP crowned its national football champion after the regular season, before the bowl games were played.
That changed in 1964, when the regular-season AP champ, Alabama, lost the Orange Bowl to Texas.
Consequently, the news organization made plans to hold its poll after the bowl season, beginning in 1967, to award its national title.
Below you will find a table showing the counts of each SuperWest program’s all-time appearances plus its:
- national rank
- percentage of polls appeared in
- average ranking
- all-time highest ranking
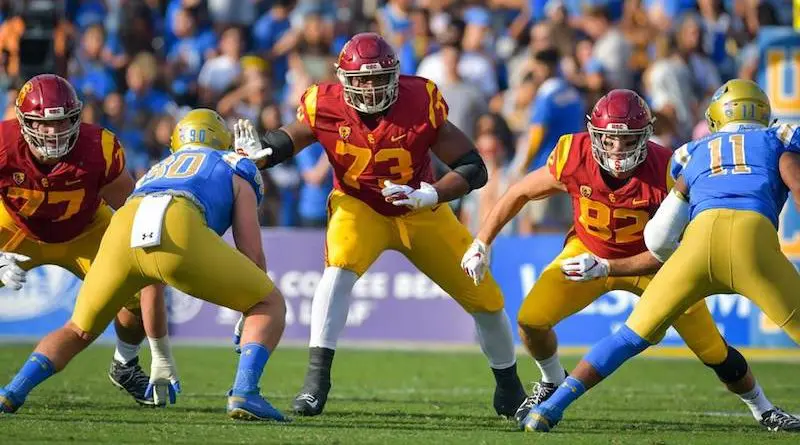
USC leads by a large margin with 819 all-time appearances, followed by UCLA with 553, Washington with 481, and Oregon with 383.
All-Time SuperWest AP Football Poll Appearances
| National Rank | Program | App | Pct | Avg | High |
|---|---|---|---|---|---|
| 6 | USC | 819 | 65.5% | 9.5 | 1 |
| 16 | UCLA | 553 | 44.2% | 12.1 | 1 |
| 20 | Washington | 481 | 38.5% | 12.1 | 1 |
| 24 | Oregon | 383 | 30.6% | 11.1 | 1 |
| 29 | Colorado | 316 | 25.3% | 11.9 | 1 |
| 32 | Stanford | 303 | 24.2% | 13.6 | 2 |
| 33 | Arizona State | 296 | 23.7% | 14.7 | 2 |
| 36 | BYU | 292 | 23.4% | 15.3 | 1 |
| 45 | California | 200 | 16.2% | 12.1 | 1 |
| 54 | Utah | 181 | 14.5% | 15.1 | 2 |
| 58 | Boise State | 178 | 14.2% | 14.7 | 2 |
| 54 | Arizona | 177 | 14.2% | 15.5 | 3 |
| 57 | Washington State | 170 | 13.6% | 16.1 | 3 |
| 65 | Oregon State | 116 | 9.3% | 15.5 | 4 |
| 69 | Air Force | 84 | 6.7% | 16.1 | 4 |
| 75 | Fresno State | 65 | 5.2% | 20.2 | 8 |
| 76 | Wyoming | 56 | 4.5% | 16.5 | 6 |
| 83 | Colorado State | 43 | 3.4% | 19.7 | 10 |
| 92 | San Diego State | 32 | 2.6% | 20.0 | 13 |
| 96 | Hawaii | 28 | 2.2% | 19.4 | 10 |
| 104 | Nevada | 16 | 1.3% | 17.2 | 10 |
| 112 | Utah State | 13 | 1.0% | 17.8 | 10 |
| 125 | San Jose State | 8 | 0.6% | 21.3 | 18 |
| 131 | New Mexico State | 6 | 0.5% | 16.5 | 14 |
| UNLV | 6 | 0.5% | 22.5 |

