
  By SuperWest Sports Staff
   February 2, 2024
In 1979, the NCAA developed the passing efficiency formula using average statistics from the previous 14 seasons of two-platoon football.
The rating ranges from −731.6 to 1261.6 and is calculated using the following formula:
{ (8.4 * yards) + (330 * touchdowns) – (200 * interceptions) + (100 * completions) } / attempts }
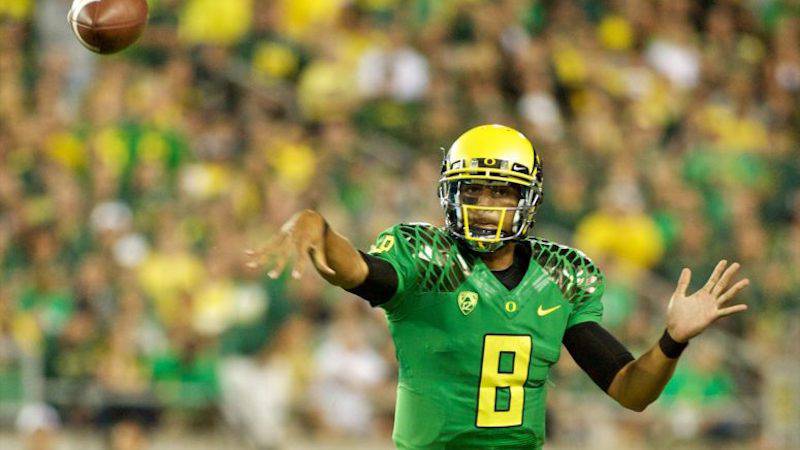
Among SuperWest players, Oregon’s Marcus Mariota leads the way with a rating of 171.8, followed by USC’s Caleb Williams, a 2023 addition, at 169.3.
A pair of Boise State quarterbacks, Kellen Moore (169.0) and Ryan Dinwiddie (168.9) rank third and fourth, respectively.
In addition to Williams, Oregon’s Bo Nix (149.6) and Washington’s Michael Penix Jr. (146.6) joined the SuperWest Top 50 list in 2023.
Below you’ll find an updated ranking of career leaders in Career Passing Efficiency Rating through 2023 with rank, years played, and school, as well as a breakdown by program.
Top 50 QBs in SuperWest Career Passing Efficiency Rating
| Rank | Player | Rating | Program | From | To |
|---|---|---|---|---|---|
| 1 | Marcus Mariota | 171.8 | Oregon | 2012 | 2014 |
| 2 | Caleb Williams | 169.3 | USC | 2021 | 2023 |
| 3 | Kellen Moore | 169.0 | Boise State | 2008 | 2011 |
| 4 | Ryan Dinwiddie | 168.9 | Boise State | 2000 | 2003 |
| 5 | Colt Brennan | 167.6 | Hawaii | 2005 | 2007 |
| 6 | Alex Smith | 164.4 | Utah | 2002 | 2004 |
| 7 | Zach Wilson | 162.9 | BYU | 2018 | 2020 |
| 8 | Andrew Luck | 162.8 | Stanford | 2009 | 2011 |
| 9 | Ty Detmer | 162.7 | BYU | 1988 | 1991 |
| 10 | Steve Sarkisian | 162.0 | BYU | 1995 | 1996 |
| 11 | David Fales | 161.7 | San Jose State | 2012 | 2013 |
| 12 | Matt Leinart | 159.5 | USC | 2003 | 2005 |
| 13 | Jaren Hall | 158.2 | BYU | 2018 | 2022 |
| 14 | Anthony Gordon | 157.1 | Washington State | 2018 | 2019 |
| 14 | Billy Blanton | 157.1 | San Diego State | 1993 | 1996 |
| 16 | Jim McMahon | 156.9 | BYU | 1977 | 1981 |
| 17 | Cody Kessler | 156.4 | USC | 2012 | 2015 |
| 18 | Jake Haener | 156.2 | Fresno State | 2018 | 2022 |
| 19 | Kevin Hogan | 154.6 | Stanford | 2012 | 2015 |
| 20 | John Dutton | 154.4 | Nevada | 1994 | 1997 |
| 21 | Darron Thomas | 154.1 | Oregon | 2008 | 2011 |
| 22 | Grant Hedrick | 153.7 | Boise State | 2011 | 2014 |
| 22 | Sam Darnold | 153.7 | USC | 2015 | 2017 |
| 24 | Justin Herbert | 153.1 | Oregon | 2016 | 2019 |
| 25 | Derek Carr | 152.8 | Fresno State | 2009 | 2013 |
| 26 | Josh Wallwork | 152.7 | Wyoming | 1995 | 1996 |
| 27 | Tyler Huntley | 152.6 | Utah | 2016 | 2019 |
| 28 | Trent Dilfer | 151.2 | Fresno State | 1991 | 1993 |
| 29 | Max Hall | 151.1 | BYU | 2007 | 2009 |
| 30 | Brett Hundley | 150.8 | UCLA | 2012 | 2014 |
| 31 | David Carr | 150.7 | Fresno State | 1997 | 2001 |
| 32 | Jake Browning | 150.5 | Washington | 2015 | 2018 |
| 33 | Aaron Rodgers | 150.3 | California | 2003 | 2004 |
| 34 | Steve Young | 149.8 | BYU | 1981 | 1983 |
| 35 | Troy Aikman | 149.7 | UCLA | 1984 | 1988 |
| 36 | Bo Nix | 149.6 | Oregon | 2019 | 2023 |
| 37 | Robbie Bosco | 149.4 | BYU | 1983 | 1985 |
| 38 | Brett Rypien | 149.3 | Boise State | 2015 | 2018 |
| 39 | Koy Detmer | 148.9 | Colorado | 1992 | 1996 |
| 40 | Danny White | 148.8 | Arizona State | 1971 | 1973 |
| 41 | Nick Stevens | 148.7 | Colorado State | 2014 | 2017 |
| 41 | Matt Barkley | 148.7 | USC | 2009 | 2012 |
| 43 | Mike Maxwell | 148.5 | Nevada | 1993 | 1995 |
| 44 | Taylor Kelly | 147.7 | Arizona State | 2011 | 2014 |
| 45 | John Walsh | 147.6 | BYU | 1991 | 1994 |
| 46 | Carson Strong | 147.4 | Nevada | 2018 | 2021 |
| 46 | Cameron Rising | 147.4 | Utah | 2020 | 2023 |
| 48 | Shaun Carney | 146.9 | Air Force | 2004 | 2007 |
| 49 | Cole McDonald | 146.8 | Hawaii | 2017 | 2019 |
| 50 | Michael Penix Jr. | 146.6 | Washington | 2018 | 2023 |
(Minimum 325 pass completions through the 2023 Season)
Breakdown by Program
9—BYU
5—USC
4—Boise State
4—Fresno State
4—Oregon
3—Nevada
3—Utah
2—Arizona State
2—Hawai’i
2—Stanford
2—UCLA
2—Washington
1—Air Force
1—California
1—Colorado
1—Colorado State
1—San Diego State
1—San Jose State
1—Washington State
1—Wyoming