This is the first in a series of stats and records analysis columns by our Stephen Vilardo, who you may know from his frequent and informative Twitter stat postings as @SERCenter. (If you don’t yet follow him, you should.)
Vilardo will cover a variety of Pac-12 statistical topics this season, from situational analysis and trend tracking to matchup breakdowns and player milestones.

  By Stephen Vilardo, SuperWest Sports
   November 2, 2020
With the Pac-12 season set to kickoff on November 7th, it’s a good time to dig a little deeper into a game-deciding metric from prior seasons: short-yardage rushing and passing situations.
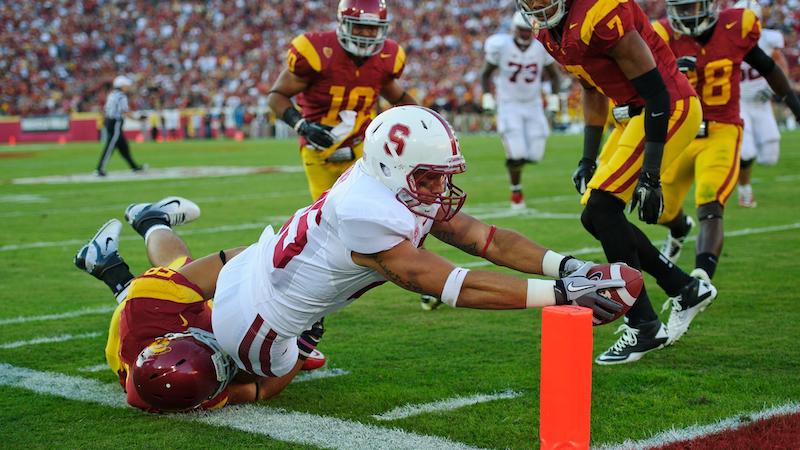
![]() Success in third-and-short situations, both with the ball and without, can prove to be the difference in wins and losses.
Success in third-and-short situations, both with the ball and without, can prove to be the difference in wins and losses.
Let’s look at who has been the most successful in the Conference, both individually and as a team. For these stats, we’re going to look mostly at Pac-12 Era, those years since the addition of Utah and Colorado, from 2011 to 2019.
Short-Yardage Rushing Plays
Looking only at the most first down carries in third-and-short situations (1-3 yards needed) in a single season, Stanford’s Tyler Gaffney owns the most, collecting 29 first downs on 41 attempts in 2013.
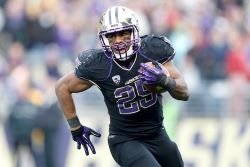
That same season, Washington‘s Bishop Sankey went 27 of 30 for a 90.0% conversion rate, compared to Gaffney’s 70.7%. Sankey’s 90% conversion rate in 2013 was the second highest single-season conversion rate among Pac-12 players with at least 15 carries in that situation since 2009.
In 2017, Arizona State‘s Kalen Ballage converted 90% as well, but with just ten attempts, and Jake Browning converted 92.3% of his 13 attempts for Washington in 2018.
The best mark in a season belongs to Myles Gaskin, who went 17 for 17 in 2017. Washington has been particularly good in short-yardage situations. Also in 2017, Ryan Nall of Oregon State converted 17 of 20 attempts, a rate of 85.5%.
Over a two year stretch between 2014 and 2015, Devontae Booker converted on 40 of 53 attempts for the Utes for a 75.5% success rate. Booker averaged 7.08 yards per carry on 25 third-and-short attempts in 2014. That 7.08 yards per carry average is the ninth best the conference has seen since 2009.
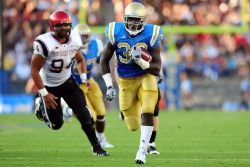
Derrick Coleman averaged 15.6 yards on 10 attempts in 2010 for UCLA, with another Bruin, Myles Jack, coming to the offensive side of the ball as a freshman in 2013, averaging 13.3 yards per carry on 10 third-and-short attempts. Interestingly, in Jack’s case, his 10 rushes resulted in three runs of over 20 yards, and four runs of under 2 yards.
Over a three-year period spanning the 2009-11 seasons, Chris Polk of Washington carried the ball 64 times on third-and-short, converting 40 of those attempts for 62.5%.
 USC has posted the best single season success rate on third-and-short running plays since the 2011 season, with a 78.1% conversion rate in 2016. Stanford’s 76.3% in 2011, UCLA’s 75.8% in 2017, Oregon‘s 75.5% in 2011, and Washington’s 75.0% in 2013, all had 75%+ rates for a single season.
 California’s 2013 squad was on the other end of things with a 40.0% success rate on third-and-short rush attempts. Utah and Colorado had rates of 43.8% and 45.2% in 2012, with UCLA’s 45.7% in 2011 joining them as the only single season marks below 46%
 Since 2011, Stanford has had the most success running on third-and-short with the Cardinal converting on 64.6% of those situations in the last nine years. Washington has been the second most successful conversion rate at 63.8%, with Oregon third at 62.7%.
Tellingly, those three teams are also among the top four in conference wins during that time.
The table below shows the third-down success rate on rushing plays for each team during the Pac-12 era.
| Team | Att | Yards | Yds/Carry | TDs | 1st Downs | Conv. Rate |
|---|---|---|---|---|---|---|
| Stanford | 333 | 1171 | 3.52 | 31 | 215 | 64.6% |
| Washington | 309 | 1369 | 4.43 | 28 | 197 | 63.8% |
| Oregon | 362 | 1792 | 4.95 | 35 | 227 | 62.7% |
| UCLA | 321 | 1212 | 3.78 | 25 | 201 | 62.6% |
| USC | 290 | 1355 | 4.67 | 14 | 181 | 62.4% |
| OSU | 218 | 741 | 3.4 | 14 | 136 | 62.4% |
| Arizona | 338 | 1297 | 3.84 | 29 | 210 | 62.1% |
| WSU | 161 | 647 | 4.02 | 15 | 99 | 61.5% |
| ASU | 340 | 1302 | 3.83 | 33 | 202 | 59.4% |
| Colorado | 340 | 122 | 3.59 | 22 | 200 | 58.8% |
| Utah | 385 | 1528 | 3.97 | 23 | 225 | 58.4% |
| California | 261 | 911 | 3.49 | 13 | 139 | 53.3% |
Not to overlook the defensive, the same chart of stops on third-and-short from the other side of the ball appears below.
| Team | Att | Yds Allowed | Yds/Carry | TDs | 1st Downs | Conv. Rate |
|---|---|---|---|---|---|---|
| Arizona State | 297 | 1109 | 3.73 | 29 | 166 | 55.89% |
| Washington State | 312 | 1090 | 3.49 | 26 | 179 | 57.37% |
| Washington | 322 | 1022 | 3.17 | 24 | 188 | 58.39% |
| Utah | 234 | 840 | 3.59 | 13 | 137 | 58.55% |
| UCLA | 351 | 1375 | 3.92 | 32 | 209 | 59.54% |
| Stanford | 265 | 988 | 3.73 | 12 | 161 | 60.75% |
| Arizona | 346 | 1295 | 3.74 | 33 | 211 | 60.98% |
| USC | 264 | 922 | 3.49 | 10 | 162 | 61.36% |
| Oregon State | 307 | 1354 | 4.41 | 23 | 191 | 62.21% |
| Oregon | 339 | 1286 | 3.79 | 21 | 211 | 62.24% |
| Colorado | 299 | 1273 | 4.26 | 26 | 187 | 62.54% |
| California | 342 | 1409 | 4.12 | 24 | 221 | 64.62% |
 Colorado and Cal find themselves near the bottom of both charts, and not coincidentally, have also ranked 12th and 10th in the Conference win percentage during that time. The outlier defensively is the Ducks, showing that a team can survive without being great on one of these charts—but you certainly don’t want to be at the bottom of both.
Short-Yardage Passing Plays
 Looking at passing plays on third-and-3 yards to go or less, Arizona has had the most success. The Wildcats have converted 58.0% of their 138 pass attempts on third and short since 2011.
 Not surprisingly, Washington State has put the ball in the air on third and short more than any other Pac-12 team. The Cougars have 308 passing attempts at that down and distance with a third-down conversion rate of 50.6%. The other 11 teams combined to put the ball in the air an average of 171.9 times on third-and-short.
 Looking at the overall success of teams on third-and-short since the Conference expanded in 2011, Arizona, Oregon and Washington have been the most efficient with conversion rates of 60%+ on all third-and-less-than-3 yards-to-go attempts.
The chart below shows the full Pac-12 rates on third-and-short since 2011.
| Team | Att 1-3 Yards | 1st Downs | Conv. Rate |
|---|---|---|---|
| Arizona | 476 | 290 | 60.9% |
| Oregoon | 474 | 288 | 60.8% |
| Washington | 462 | 280 | 60.6% |
| UCLA | 466 | 279 | 59.9% |
| Stanford | 489 | 289 | 59.1% |
| USC | 409 | 240 | 58.7% |
| Arizona State | 531 | 307 | 57.8% |
| Colorado | 483 | 278 | 57.6% |
| Oregon State | 391 | 224 | 57.3% |
| Utah | 494 | 269 | 54.5% |
| Washington State | 469 | 255 | 54.4% |
| California | 452 | 237 | 52.4% |
Pac-12 Career Player Stats Watch
Tyler Vaughns, USC

Vaughns’ 189 career receptions are 40th all-time in Pac-12 history. 222 will get him into the top 15. The senior needs 187 receiving yards to crack the top 50 for career yards receiving. He is five TD receptions from the top 35 in Pac-12 history, he has 17 entering 2020.
Oscar Draguicevich, Washington State

Draguicevich is averaging 45.46 yards per punt for his career, that is currently the second highest career average in Pac-12 history. Mitch Wishnowsky of Utah holds the record at 45.74 yards per punt. Tom Hackett of Utah is the only other conference punter to average over 45 yards per punt for a career.
Have a question for Stephen? Ask it here.

-
Ranking the Big Ten Football Head Coaches Entering 2026
> Our Stephen Vilardo evaluates the lead men in the conference ahead of the upcoming season - July 16, 2026 -
10 Teams From West Most Likely to Make the 2026 Playoff
> Stephen Vilardo explains why these 10 teams have a reasonable chance of landing in the CFP - July 1, 2026 -
Ranking the Mountain West Football Coaches for 2026
> Our Stephen Vilardo evaluates the head men in the reconstituted league after realignment - June 10, 2026